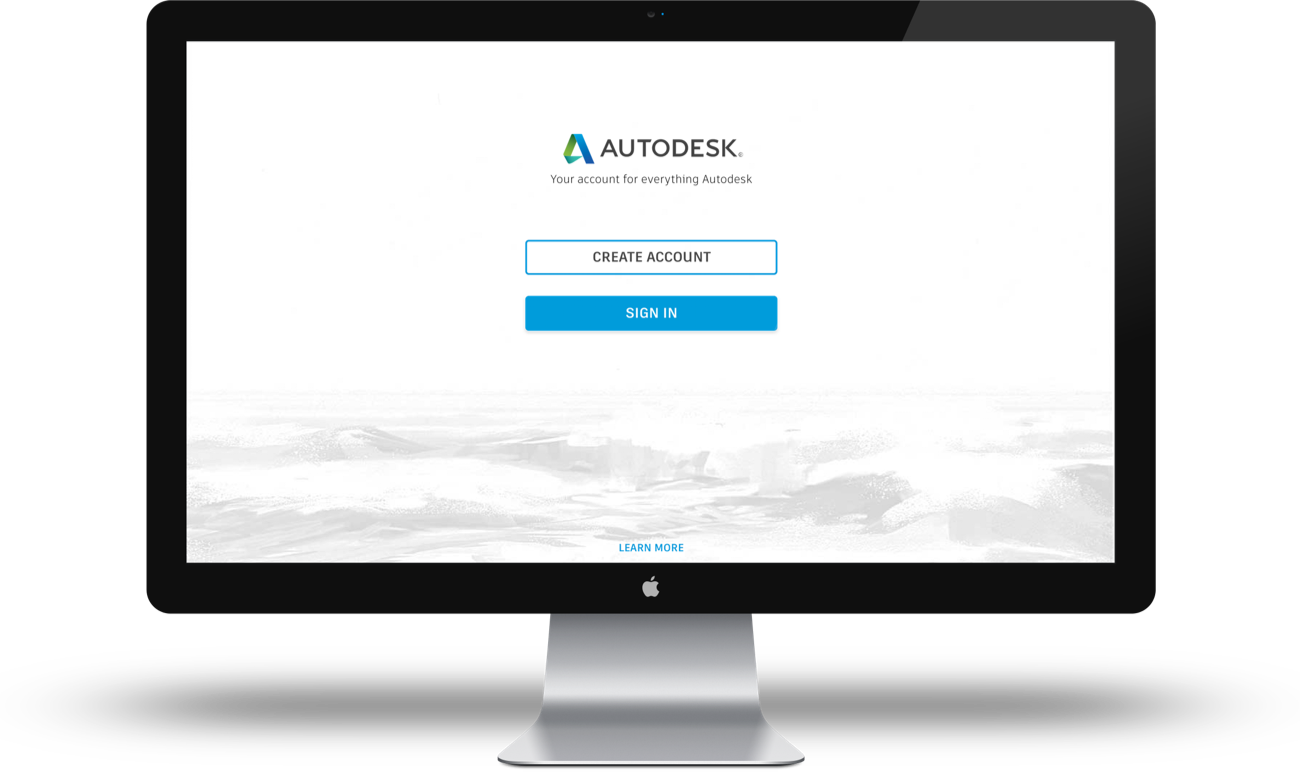
Oxygen is the identity platform for all of Autodesk.
Visit it on accounts.autodesk.com
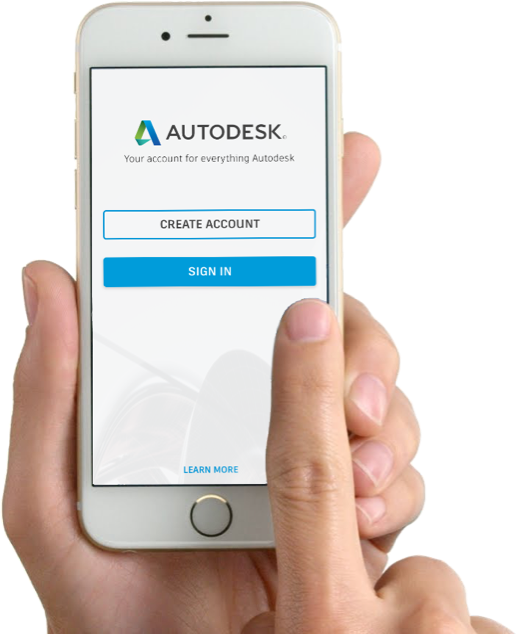
Visit it on accounts.autodesk.com
| Project: | V3 overhaul |
| Roles: | Lead researcher & designer |
| Timeline: | Dec '15 to Jun '16 |
| Goal: | Design overhaul of the identity platform with the goal of optimizing the user accounts conversion rate. |

This project was initiated when 2 major products reported low levels of new user adoptions with significant drop-offs occuring at the point of account creation.
A series of studies were immediately triggered to determine the report's validity.
Drilling into event logs and clickstream analytics, it was evident that the reports were true where more than 25% of attempts did not make it through the account creation form.
To understand the scope and causality of the issue, a series of activities were conducted, with the following outputs.
There were multiple stakeholders involved in this project. Ranging across various brand, product and legal teams, it was imperative to weigh, balance and manage the expectations of these stakeholders.
Remote phone and video interviews were conducted across multiple timezones. Given the significant portion of the representative users were not based in Singapore, it was a challenge trying to manage interview schedules.
Automated screen recordings of user activities were triggered through Hotjar. Out of the ~100k sessions recorded, there were several patterns observed. One in particular centered around users working across products. It was an important insight that called for further research.
The research findings channeled into insights that were eventually used to drive the product roadmap, and executable tasks through Jira epics and user stories.
Trying to properly understand users behaviors was an arduous task. The complexity of querying, mapping and correlating between back-end SQL tables & Splunk logs against Omniture & Google Analytics clickstream data was significantly harder than what was initially perceived.
For any research, work is not done till proper documentation and presentation is done. Even so, proper awareness has to be made so that the stakeholders are on board. Analysis, feedback and reported usability metrics spanning aross effectiveness, efficiency and satisfaction were shared and appropriately filed.
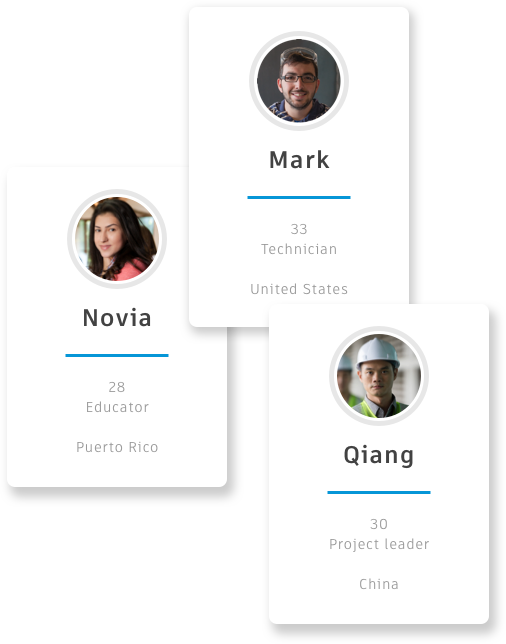
Using data gathered from the research, persona cards and journey maps were created to promote empathy, mindshare and understanding of our users. Understanding the users' pains and motivations goes a long way, helping the development
team work out appropriate goals for the solution and design quality test cases.
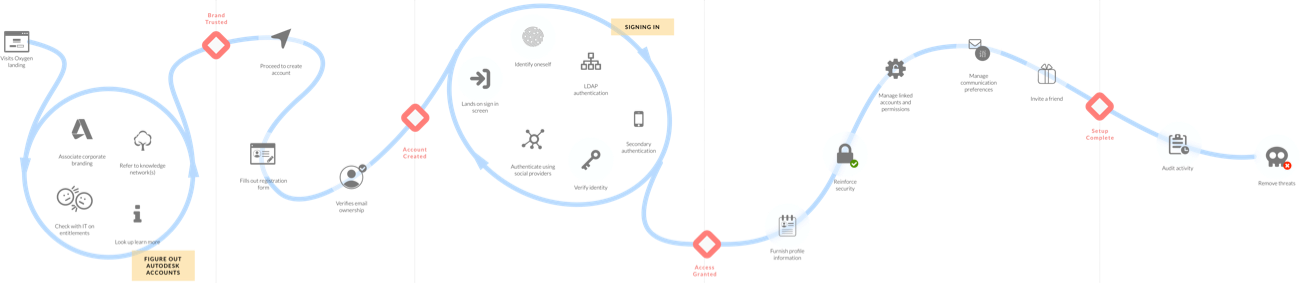
The journey maps that illustrate the different touchpoints across the multiple phases of the customer lifecycle, helps to provide a visual overview, a narrative that indicates problematic areas where changes are required.
From the tactical approach, screen flows corresponding to the user journey were created, tagging areas of change based on content, workflow, user interface and interaction elements.

Following a solid understand of the context, the next step is to involves ideation and prototyping of concepts.

Apart from swiggly hand sketches on paper, napkins and whiteboards, multiple iterations of low fidelity wireframes were also created to define the information architecture and stitched together as wire flows to illustrate the overall
navigation experience.
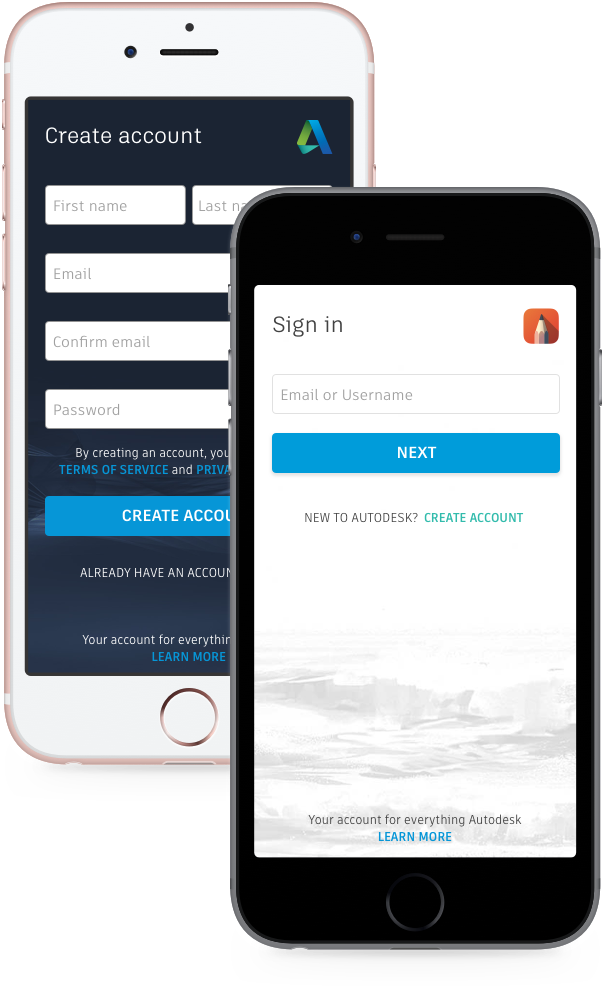
High fidelity Axure clickthrough prototypes were created to demonstrate the behavioral patterns and dynamic interactions of the user interface.
Along the way, heuristic and stakeholder reviews were conducted whereby improvements were made every cycle

Concidentally, Brand just released a new corporate font and started on a color schema for corporate identity.
It was imperative to follow these guidelines to provide consistent visual style as well as brand identity.


Develop HTML, CSS, JS front-end code to smoothen transition to development.
Continuous user testing to assess usability and seek perceptions and feedback.
Implement A/B experimentation to test copy and element attributes to optimize conversion.
Instrument and analyze usage metrics to establish baseline for continuous improvement.
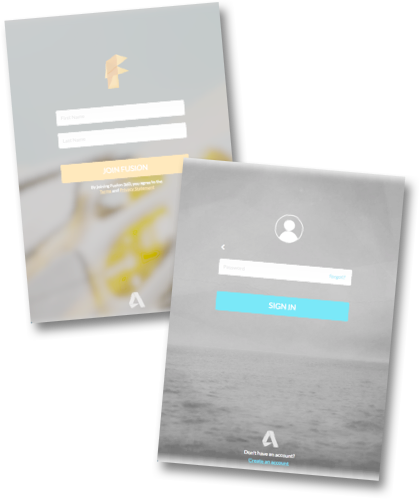
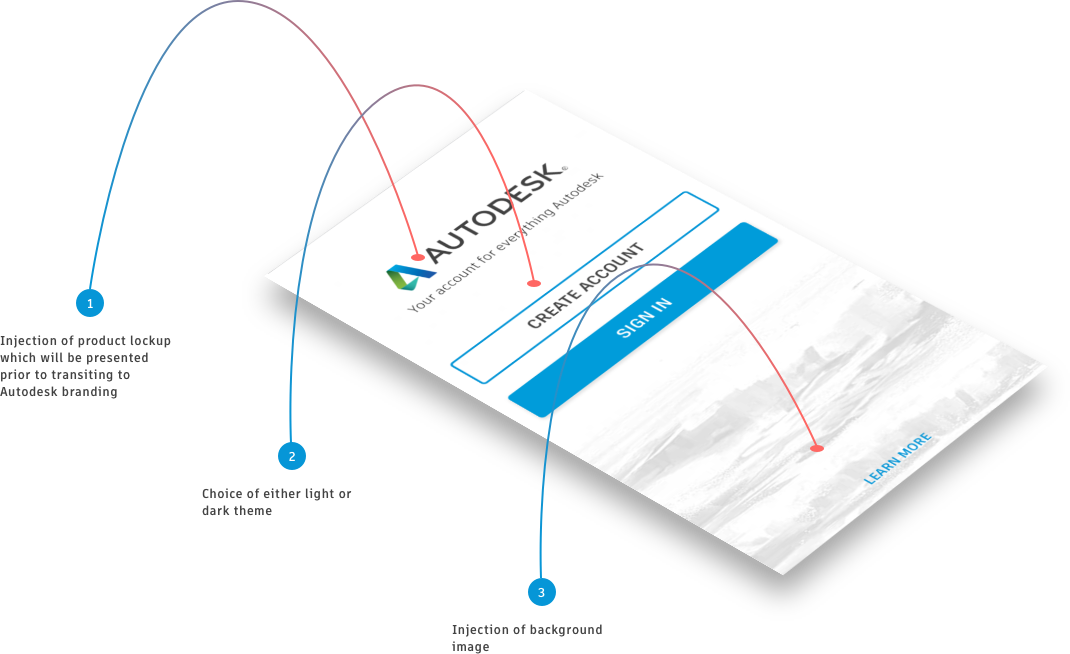
A theme-based customizable layout that is constantly measured, and is readily available for experimentation and optimization
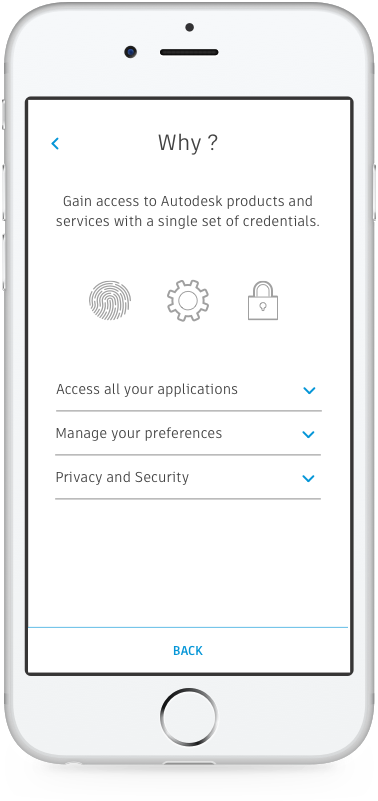
An on-screen page explaining the purpose and capabilities of Autodesk account.
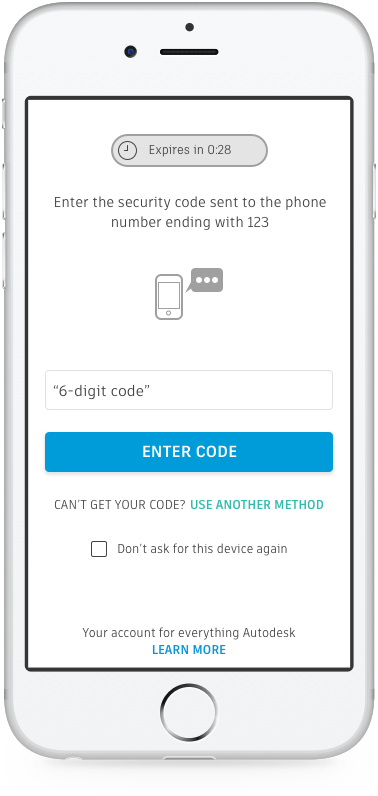
Authenticate users by something they have on top what they know

A 13.2% uplift in overall account creation